Recherchez sur le site !
Recherche avancée / SpécifiqueCatégories publications
+ Sciences De La Terre - Archéologie - Astronomie - Spéléologie - Ecologie - Pédologie - Volcanologie - L'hydrogéologie - Géomorphologie - Minéralogie - Pétrologie - Paléontologie - Géologie + Climatologie - Réchouffement climatique - Changement climatique + Plantes - Plantes Aromatiques - Plantes médicinales + Zoologie - Faunes + Botanique - Flors + Sciences humaines - Géo Eco Tourisme - L’anthropologie - L'Histoire - Démographie - Sociologie - Géographie - Patrimoine culturel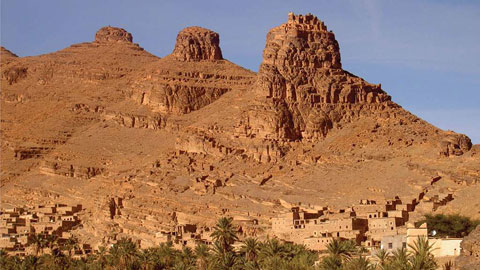
Géo éco tourisme inclusif
Géoparc et Recherche Scientifique
Le coins de l’étudiant


Blog Géoparc Jbel Bani

Analysis of annual precipitation in semi-arid climate:
Case of the Tata station from 1985 to 2016
(South of Morocco) (Géoparc jbel Bani)
Jotti Noura*, Wartiti Mohammed and Berred Sanae
Faculty of Sciences, Mohammed V-Agdal University, Laboratory of Applied Geology: Mineral Resources, Water Resources,
Geological Heritage and Environment, Rabat, MOROCCO
*nourjotti@gmail.com
Abstract
In recent years, Saharan cities have been seriously affected by natural disasters related to hostile meteorology. The city of Tata is an example of those cities that suffer from catastrophic and devastating occasional floods, torrential erosion and desertification. These risks will be aggravated, by 2030, by urban growth and will be added to the impacts of the increase in temperature linked to global warming3,7-9. In the context of climate change, we propose for the weather station Tata, to study the behavior of interannual rains. The city of Tata is confronted with several irregular rainfall disturbances9.
In terms of monthly rainfall, the month of November, which has never exceeded 40 mm since 1985 and sometimes does not record any precipitation, recorded 146 mm in 2014, which caused exceptional and deadly floods. Some months have much higher than normal rainfall such as September 2014 with 88 mm and October 1994 with 105 mm and 520.4 in 2000 and February with 106.5 mm in 2010 and August with 104.6 in 1998. On the annual plan, rainfall variations reach real periods of drought; this is the case for the year 1992 with 11.7 mm, 2001 with 7.5 mm and 2008 with 2.4 mm. This study aims to analyze the rainfall of the Tata station for a 31-year chronic (1985-2016), determine rainfall trends and extract the rainfall variability which are at the origin of all the disasters of storms that occur as well as define the extremes of rainfall heights and in order to provide explanations about the floods and the real drought that the city knows6, 11.
Keywords: Climate change, Floods, Rainfall variability, Tata village, Trend analysis, Periodicity.
Introduction
The extreme weather conditions and droughts that regularly hit the city of Tata and its surrounding areas pose significant risks to humans, their property and the ecosystem 5,12. In this context, the main objective set for this study is to analyze and define the different modes of rainfall variability in order to find explanations for these climatic disturbances during the period extending from 1985 to 2016.
An approach that would allow us to consider regular investigations of preventions to try to limit the consequences, often devastating when this happens and save humans, destruction of ecosystem and safeguard the infrastructures.
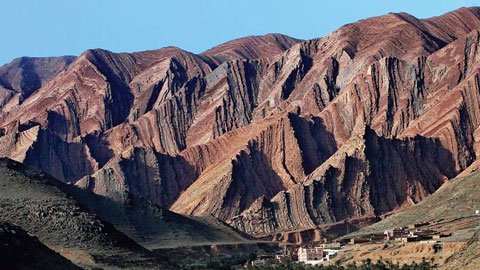
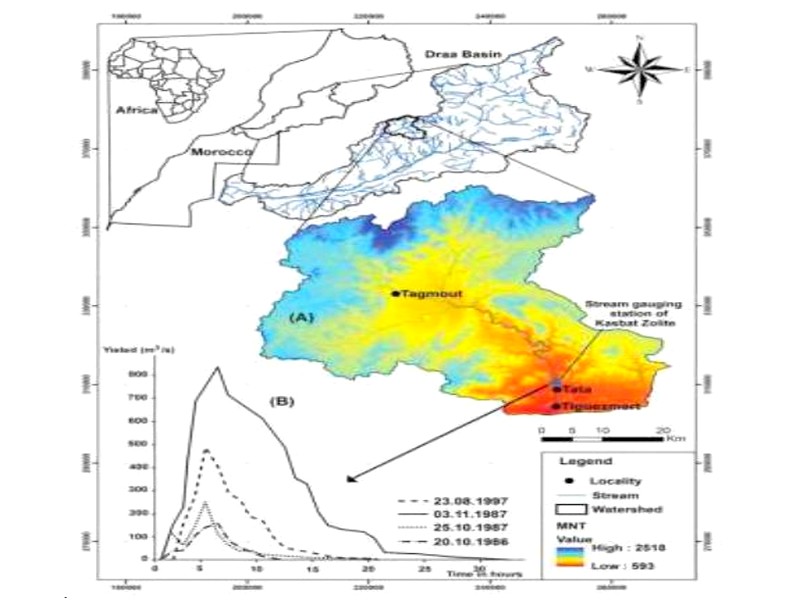
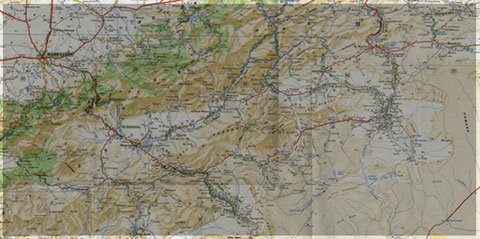
Material and Methods Presentation of the study area: The province of Tata is located in the pre-Saharan zone in southern Morocco. Its territory extends from the south side of the Anti-Atlas to Oued Drâa which marks the border with Algeria and the Saharan regions. Tata is at an altitude of 670 m, peaks and passes around 800 to 1000 m (the chains of the Anti-Atlas rise up to 2500 m). Oued Darâa, at the mouth of Oued Tata, is 335 m above sea level (Figure 1). The source of Oued Darâa is further east at the level of the Anti-Atlas.
Research Methodology: Monthly data for the period extending from the year 1985 to the year 2016 was obtained from the Water Directorate of Rabat and the Sub-Massa-Darâa Watershed Agency of Agadir. The purpose of this investigation is to study the rainfall regime and to analyze the rainfall evolution of the Tata station.
From the monthly statements examined we deduce the annual precipitation according to the formulas:
Pa = ΣPm
Where Pa = annual precipitation and PM = monthly precipitation
To study the evolution and variability of rainfall in this study area, we used1:
The drought index (SI): it is the index of the deviation to the average. It makes it possible to estimate the annual rainfall deficit. This difference in the mean is the difference between the rainfall height of a year Pi and the average annual precipitation height P of the series.
The formula is:
IS = Pi – P
Where the index is positive for wet years and negative for dry years. The rainfall index (PI) is the ratio of the rainfall height of a year Pi to the annual average rainfall P of the series. The formula is:
IP = PI / p
So, a year is called wet if this ratio is greater than 1 and dry if it is less than 1.
In the same order, the averaging of rainfall totals and the division of the five-year series made it possible to understand periodically very irregular behavior of the precipitation of the studied station.

Figure 1: Geographic situation of Tata basin: (A) Digital Elevation Model (DEM),B) Discharge hydrograms of Tata. (After Echogdali FZ)
Results and Discussion
The analysis of interannual precipitation trends at the Tata station between1985-2016 indicates a very great heterogeneity. In addition, there is an alternation of wet cycles and dry cycles during the thirty years observed.
(Figure2). Annual data processing has shown that the general trend is for continuous decreases in precipitation at the Tata meteorological station. Figure 2 highlights this decline in rainfall. The years 1966, 1984, 1985 with respectively 2142,1mm; 2066,1mm and 2056,7 mm were the wettest while the years 1942 (1151,1mm) and 1992 (1142,1mm) showed severe rainfall deficits. Overall, annual average rainfall averages of five years between 1985 and 2016 indicate that a five-year period was wet between 1995 and 2000 (Figure 3), but it does not remain constant, followed by a decline in rainfall in particular. The observation of the evolution of rainfall averages obtained every five years confirms this drop in the annual rainfall in Tata between 1985 and 2016. We note that the averages recorded for 1985 and 2016 have decreased despite the wet period observed between 1995 and 2000 (Figure 3).

Figure 2: Annual rainfall at Tata Station

Figure 3: Evolution of the five-year annual averages in Tata
The evolution of the five-year averages shows a decrease in rainfall between 2000 and 2016 and the long drought period following the wet period from 1995 to 2000 (Table 1). This decrease in rainfall is not only noticeable at the scale of the analysis of interannual precipitation trends but also at the level of five-year averages. The hydrological drought observed between 1985 and 2016 resulted in severe rainfall deficits. Table 2 illustrates some examples of years with considerable water drought.

Figure 4: Annual rainfall curves for a few years at Tata
Table 1
Evolution of rainfall averages (five-year) at Tata between 1985 and 2015

Table 2
Illustration of some cases of water drought between 1985 and 2016 in Tata

Conclusion
The analysis carried out in this study made it possible to draw up an inventory of the variability of the precipitations, by releasing at the same time the humid, deficit periods while indicating the general tendency that emerges.
Cumulative Annual and Five-Year Rainfall Analysis indicates that Tata Weather Station has a long dry period interrupted from time to time by some wet years and recorded severe deficit years during the period studied with non-homogeneous frequencies.
The results obtained at Tata between 1985 and 2016 can be considered fictitious in this area which are very vulnerable to climate hazards as hostile as we imagine. These deductions drawn from this analysis could be useful for all types of development of the regional territory of Tata on one hand and as a warning guide to anticipate possible assessments of heavy consequences of bad weather when this occurs on the other hand. Vigilance is recommended for the study of rainfall monitoring and its analysis in an attempt to limit the impact of recurring climate disaster.
Acknowledgement
We would like to thank the Faculty of Science and the Hydraulic Department of Rabat for encouraging us and giving us the opportunity to do this scientific research by allowing climate data.
Références
1. Bertrand D., Variabilité et tendances pluviométriques dans le nord-ouest de la Centrafrique: enjeux environnementaux, Mémoire online, Université d'Abomey-Calavi - DEA (2007)
2. Cattle H. and Boscolo R., CLIVAR/Commission for Climatology ETCCDI contributions to studies of climate extremes, Geophysical Research Abstracts, 9, 5 (2007)
3. Dahroni, Arozaq M. and Khoirunisa N., Disaster Risk Reduction and Climate Change Investment in Disaster Education Context, Sumatra Journal of Disaster, Geography and Geography Education, 1(2), 79-83 (2017)
4. Echogdali F.Z., Boutaleb S., Jauregui J. and Elmouden A., Cartography of Flooding Hazard in Semi-Arid Climate: The Case of Tata Valley, South-East of Morocco, Geography and Natural Disasters, 8, 1 (2018)
5. IPCC, Managing the risks of extreme events and disasters to advance climate change adaptation, Special report of the Intergovernmental Panel on Climate Change, Intergovernmental panel on climate change: 978-1-107-02506-6 (2012)
6. Karmaoui A., Balica S.F. and Messouli M., Analysis of applicability of flood vulnerability index in Pre-Saharan region, a pilot study to assess flood in Southern Morocco, Nat. Hazards Earth Syst. Sci. Discuss, doi:10.5194/nhess-2016-96 (2016)
7. Karmaoui A., Messouli M., Yacoubi Khebiza M. and Ifaadassan
I., Environmental Vulnerability to Climate Change and Anthropogenic Impacts in Dryland, (Pilot Study: Middle Draa Valley, South Morocco), J Earth Science Climatic Change, S11, 1-12 (2014)
8. Mahé G. and L'hôte Y., Sahel: une sècheresse persistante et un environnement profondément modifié, La Météorologie, 44(8), 2-3 (2004)
9. New M., Evidence of trends in daily climate extremes over Southern and West Africa, Journal of Geophysical Research, 111, D14102 (2006)
10. Royaume Du Maroc, Conseil Régional du Tourisme Guelmim Résidence Sahara, monographie de Tata, Réf : 3_Tata_14_1_x152 (2008)
11. Sivakumar M.V.K., Das H.P. and Brunini O., Impacts of present and future climate variability and change on agriculture and forestry in the arid and semi-arid Tropics, Climate Change, 70, 31-72 (2005)
12. Odon Q., Liverani A., Joseph G. and Bougnoux N., Extreme
Weather Events and Migration: The Case of Morocco, MPRA, World Bank (2014).
(Received 24th October 2019, accepted 26th November 2019)
Source web Par: Prof. Jotti Noura, Prof. Wartiti Mohammed and Prof. Berred Sanae
Dictionnaire scientifique
Plus de 123.000 mots scientifiques
Les publications
Géo parc Jbel Bani

Circuits & excursions touristiques
cartothéques


Photothéques
Publications & éditions